Get Informed about
An Andy Wakefield Film
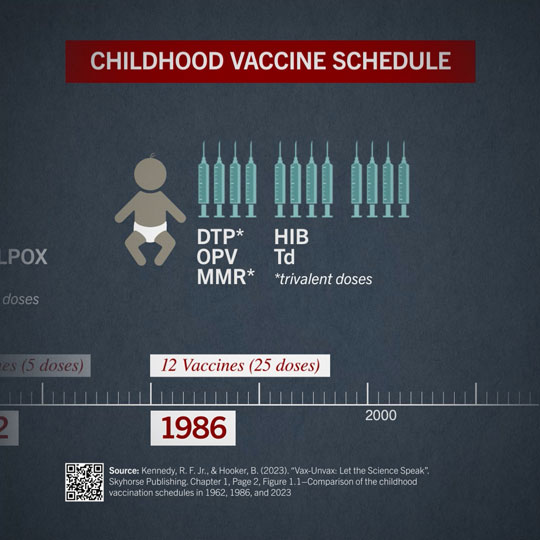
CHILDHOOD VACCINE SCHEDULE
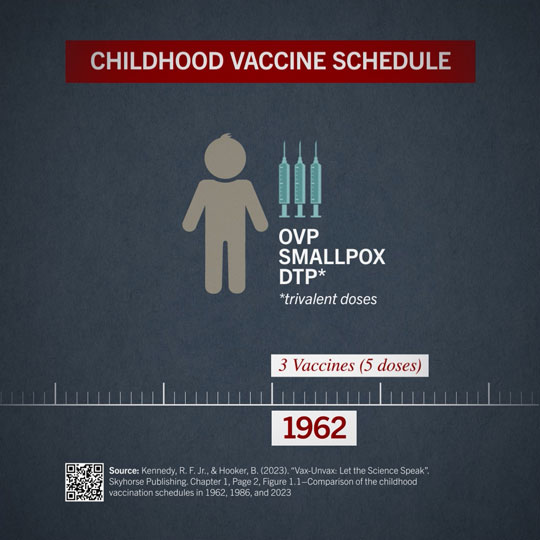
1962
In 1962, the childhood vaccination schedule consisted of 5 vaccines in 3 shots; OPV (Oral
Polio Vaccine), Smallpox, and DTP (Diphtheria-Tetanus-Pertussis) the first trivalent vaccine
administered to children.
Kennedy, R. F. Jr., & Hooker, 8. (2023). "Vax-Unvax· Let the Science Speak".
Skyhorse Publishing. Chapter 1. Page 2, Figure 1.1-Comparison of the childhood vaccination
schedules in 1962, 1986, and 2023
1986
By 1986, the schedule had grown to 25 doses of 9 vaccines. This included DTP, OPV, MMR
(introduced in 1965), the HIB, and Td vaccines. With multiple trivalent vaccines now on the
market, children could receive 6 vaccines in just two injections. Compliance was up, but there
were many cases of injury and vaccine manufacturers were paying out millions to compensate
injured recipients. They successfully lobbied Congress to reduce their liability.
Kennedy, R. F. Jr., & Hooker, 8. (2023). "Vax-Unvax· Let the Science Speak".
Skyhorse Publishing. Chapter 1. Page 2, Figure 1.1-Comparison of the childhood vaccination
schedules in 1962, 1986, and 2023
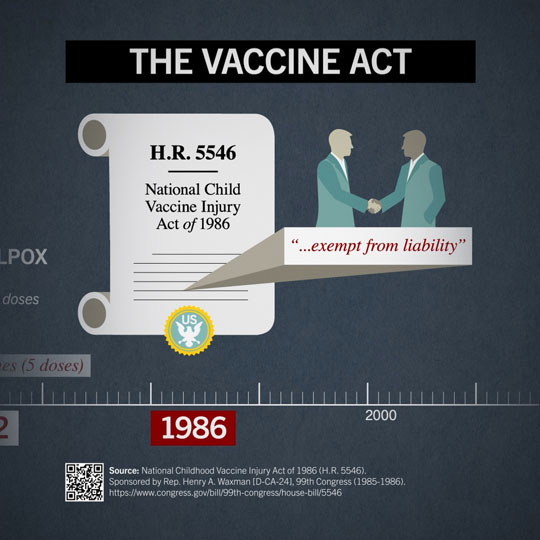
The Vaccine Act of 1986
The National Childhood Vaccine Injury Act (NCVIA) of 1986 (42 U.S.C. §§ 300aa-1 to 300aa-34)
was signed into law by United States President Ronald Reagan as part of a larger health bill on
November 14, 1986. NCVIA's purpose included the elimination the potential financial liability of
vaccine manufacturers due to vaccine injury claims, and to provide cost-effective arbitration for
vaccine injury claims in a no-fault compensation system.
Image Information Source: House Bill 5546
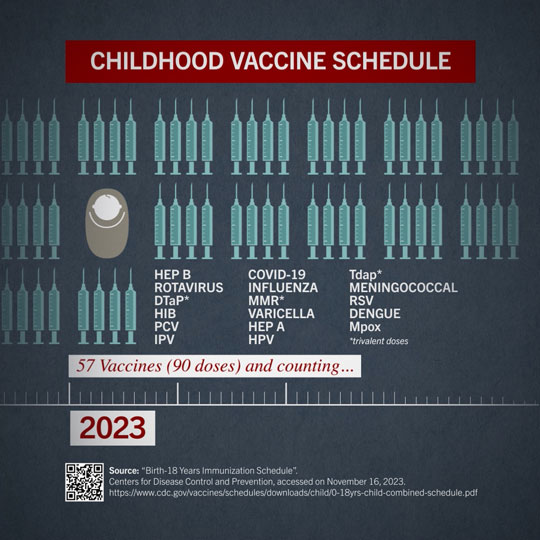
2023
In 2023, according to the CDC, children will receive 57 shots of 90 vaccines by 18 years of age.
This schedule now includes Hepatitis B vaccine (for a sexually transmitted disease) given at
birth, the MMRII (out of specification) and now the highly controversial COVID ‘vaccine’.
THE RISE IN CHRONIC DISEASE
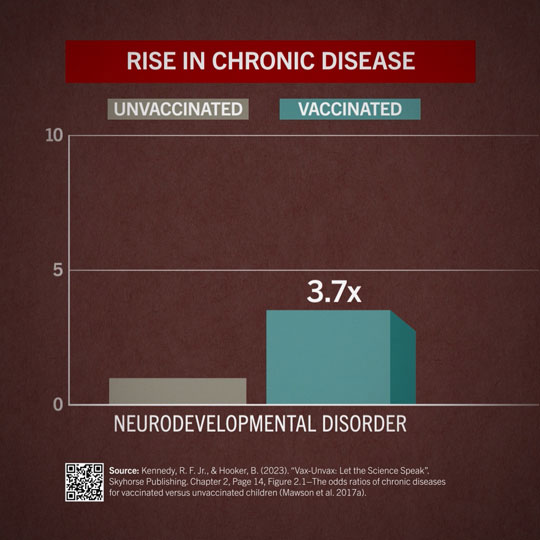
NEURODEVELOPMENTAL DISORDER
According to the literature cited in the 2023 book by Robert F. Kennedy Jr. & Brian Hooker
“Vax-Unvax: Let The Science Speak”, there is a direct correlation between the rise of childhood
chronic disease and the intensity of the vaccine program. In this image, we can see that
vaccinated children are 3.7x more likely to develop some sort of neurodevelopmental disorder
compared with unvaccinated children.
Kennedy, R. F. Jr., & Hooker, 8. (2023). "Vax-Unvax· Let the Science Speak".
Skyhorse Publishing. Chapter 2. Page 14, Figure 2.1-The Odds Ratios of chronic diseases for
Vaccinated vs. Unvaccinated Children.
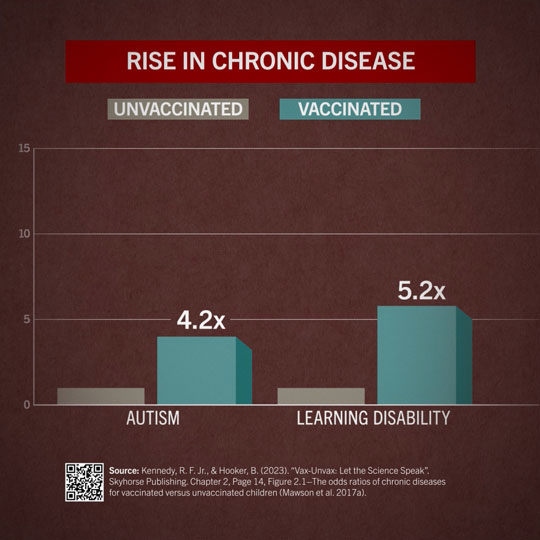
AUTISM & LEARNING DISABILITY
Autism rates continue to skyrocket in the United States and around the world. From 1 in 10,000
in the 1980’s to 1 in 36 in 2023. As we portray here in the image to the right, we can see that
the rate of autism is 4.2x higher in vaccinated versus unvaccinated children.
Image Information Source: Kennedy, R. F. Jr., & Hooker, 8. (2023). "Vax-Unvax· Let the Science
Speak".
Chapter 2. Page 14, Figure 2.1-The Odds Ratios of chronic diseases for Vaccinated vs. Unvaccinated Children.
Chapter 2. Page 14, Figure 2.1-The Odds Ratios of chronic diseases for Vaccinated vs. Unvaccinated Children.
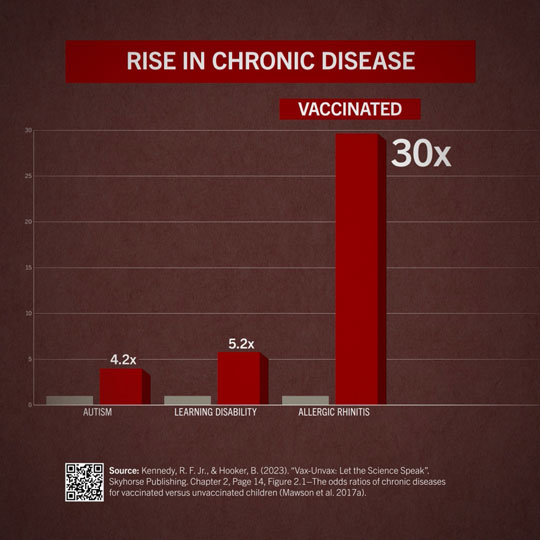
ALLERGIES
One of the most concerning depictions here is the fact that children who have been vaccinated
have a 30x higher rate of Allergic Rhinitis also known as Hay fever. These statistics are all
significant.
Image Information Source: Kennedy, R. F. Jr., & Hooker, 8. (2023). "Vax-Unvax· Let the Science
Speak".
Chapter 2. Page 14, Figure 2.1-The Odds Ratios of chronic diseases for Vaccinated vs. Unvaccinated Children.
Chapter 2. Page 14, Figure 2.1-The Odds Ratios of chronic diseases for Vaccinated vs. Unvaccinated Children.
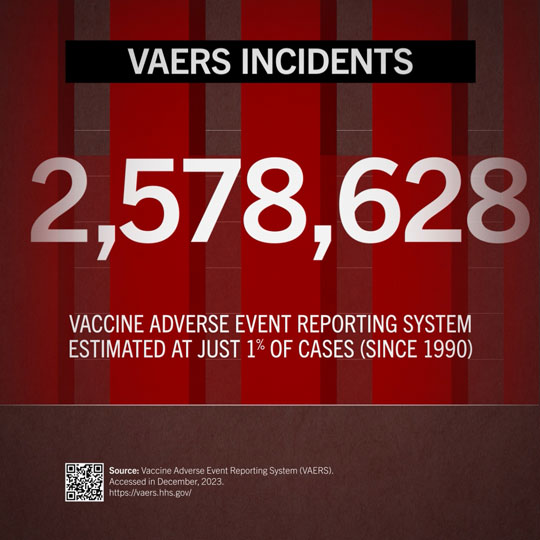
VAERS INCIDENTS
VAERS (Vaccine Adverse Event Reporting System) is unfortunately one of the only ways to
report a patient’s injury due to a vaccine. This ticker in the image to the right continues to grow
every single day. It is reported that just 1% of injuries are even reported, meaning that this
number could be 100x higher than what’s been reported thus far.
Image Information Source: Vaccine Adverse Event Reporting System (VAERS). Accessed in December, 2023.
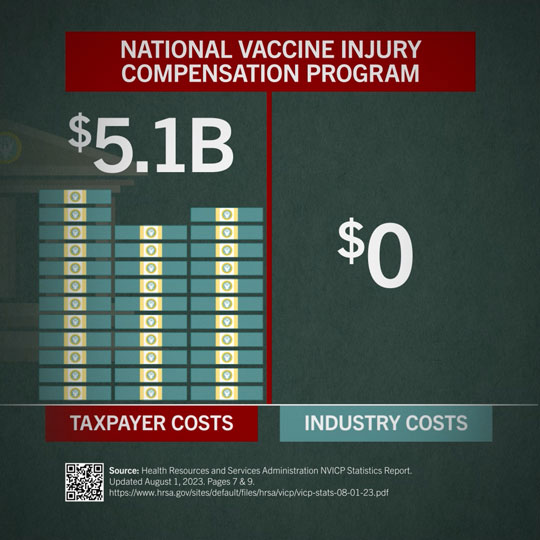
NATIONAL VACCINE INJURY
COMPENSATION PROGRAM
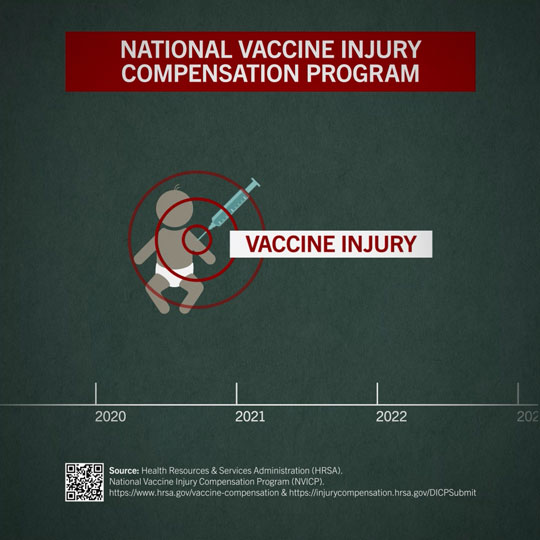
VACCINE INJURY
Vaccine injury is something that is greatly underreported. Injuries sustained in testing MUST be
placed on the product’s information sheet. These include but are not limited to; headache,
dizziness, febrile convulsions, anaphylaxis and anaphylactoid reactions, arthritis,
thrombocytopenia, encephalitis and encephalopathy.
Image Information Source:
Health Resources & Services Administration (HRSA).
National Vaccine Injury Compensation Program (NVICP).
Health Resources & Services Administration (HRSA).
National Vaccine Injury Compensation Program (NVICP).
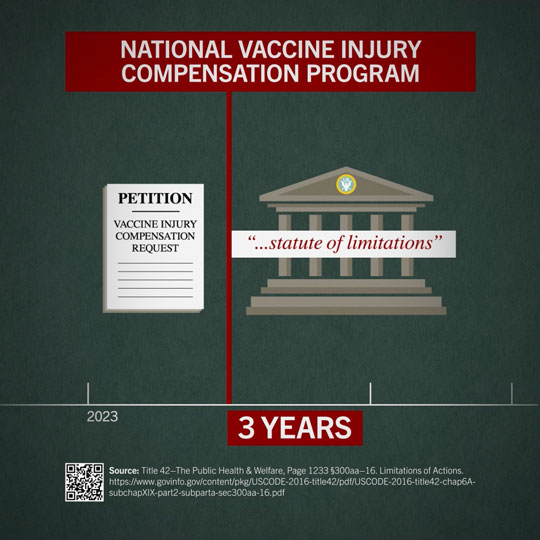
STATUTE OF LIMITATIONS
According to Title 42-The Public Health & Welfare, Page 1233 §300aa-16. Limitations of
Actions, there is a three-year statute of limitations on a request for compensation. This means
that you only have three years to file a request. The fact of the matter is that most people do
not know their child has a developmental disorder until around age 3-4, delaying diagnosis and
limiting the opportunity to file for compensation.
Image Information Source: Title 42-The Public Health & Welfare, Page 1233 §300aa-16. Limitations of Actions.
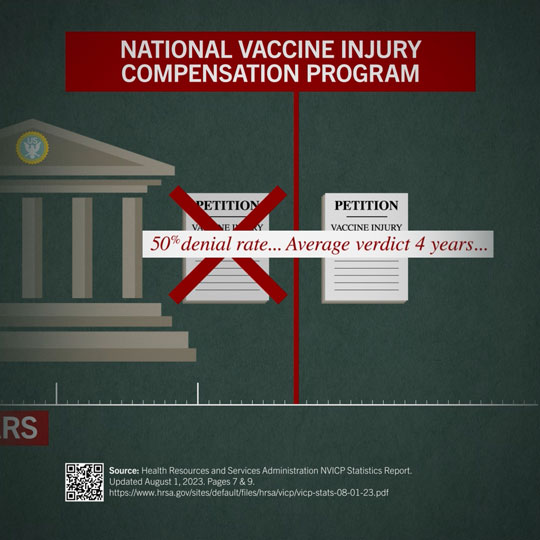
DENIAL RATE & AVERAGE VERDICT
Not only is there a statute of limitations of three years, but just over 50% of the cases are
denied during the review process. Of the remaining 50%, the ones that are actually approved
have an average verdict wait of 4 years. This makes it extremely difficult for families who are
caring for loved ones who have severe disabilities.
THE COST IS ON THE TAXPAYER
Because the manufacturers are not held liable for the claims against them (due to the Vaccine
Act of 1986), the burden falls on the taxpayer. That’s right, YOU. The taxpayers in the United
States alone have paid out over 5 BILLION dollars since 1990 and this continues to grow.